Friendly link
- NOAA
- The Regional Climate Centers in WMO RA
- APEC Climate Center
- Global Producing Centres of Long Range Forecasts(WMO GPCs)
- Intergovernmental Panel on Climate Change IPCC
- United Nations Framework Convention on Climate Change
- WMO GPC website
- Lead Centre for Long Range Forecast Verification System
- Lead Centre for Long Range Forecast Multi-Model Ensemble
Links to GPC websites
Links to NMHSs in RA II
Copyright:© 2005 ~ 2023 Beijing Climate Centre. All rights reserved. Technical support: zhongyan
address:46 South Street, Zhongguancun, Haidian District, Beijing Zip code:100081
Today:04219/Total:34181680


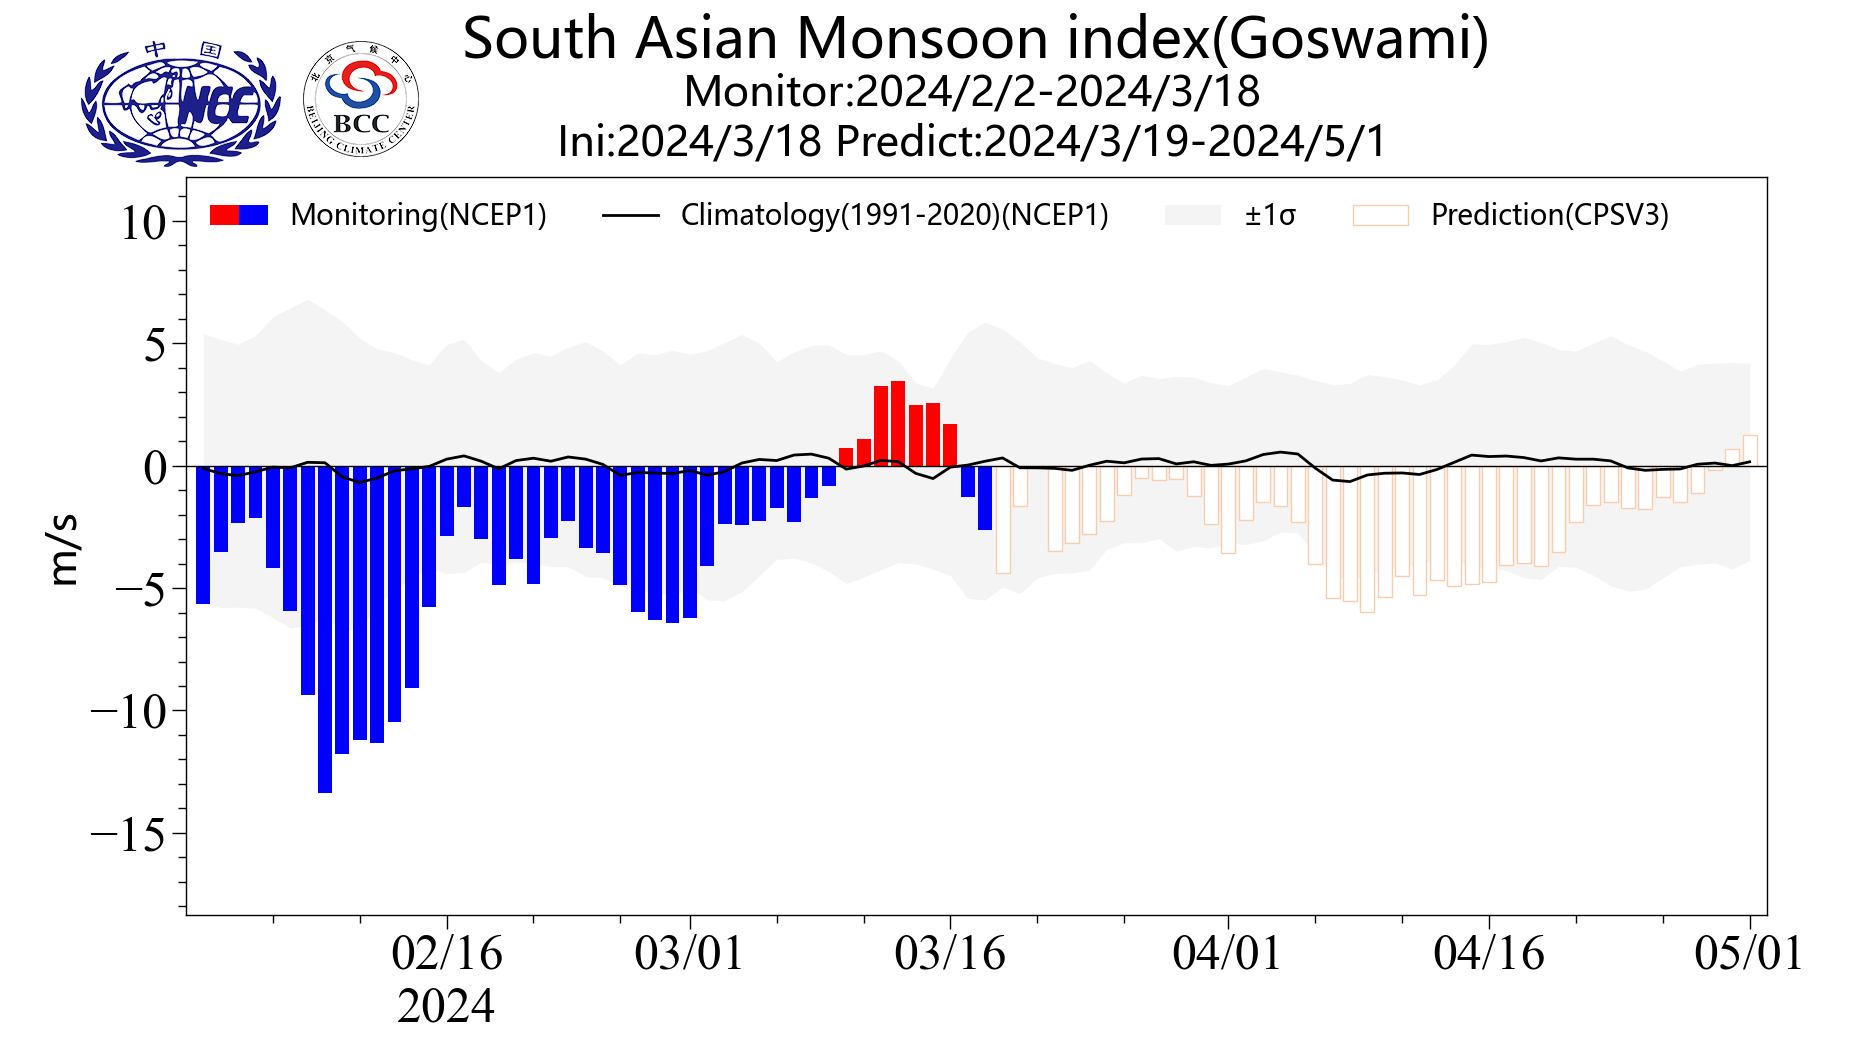
 South Asian monsoon


