Annual Highlights
Tropical
oceanic-atmospheric condition
La Niña condition terminated in spring and El Nino occurred
in summer
During
2009,a significant transition
from La Nina condition to El Nino event had occurred in the central
and eastern equatorial Pacific as mentioned following: La Nina condition terminated
in April 2009 (Fig.1), which began in the end
of 2008, then SST anomalies in the central and eastern equatorial Pacific
warmed gradually and developed into an El Nino event in June 2009(Fig.2).
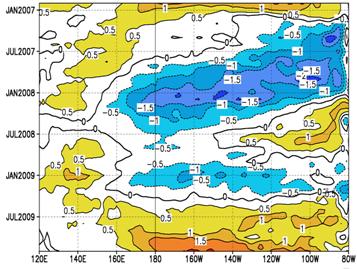
Fig.1 Time -longitude section of SSTA in the equatorial Pacific (5ºN~5ºS) (Unit:℃ )
Fig.2 Variations of Niño Z , Niño 3.4 indices (Unit: ℃ ) and SOI
During 2009, SCS
summer monsoon onset and end was later than normal, and it is weaker than average.
The 2009 South China Sea (SCS) summer
monsoon broke out in the 6th pentad of May, which was later than
normal. After the full onset of the SCS summer monsoon, the front of the summer
monsoon maintained over the region from South China to the south of the
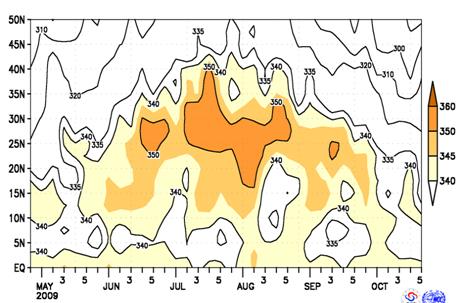
Fig.3 Latitude-time section (110°E -120°E) of
potential pseudo-temperatures (unit: K)
The SCS summer monsoon intensity index was
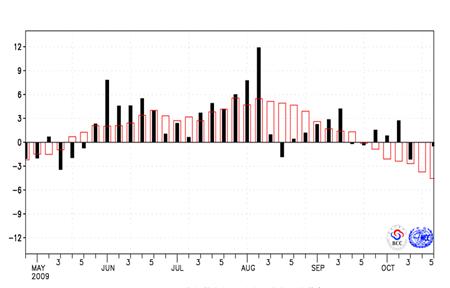
Fig.4 Variation of the zonal wind index (unit: m/s)
over the monitoring region
(10ºN -20ºN, 110°E -120ºE),(Red bars for climatological normal)
Snow Cover
During 2009, the areas of
snow cover in the Northern Hemisphere,
During Autumn
(September-October-November), the number of days with snow cover (NDSC) was
30-60 days in northern Europe, most of the regions in Asia north to 50°N and the northwestern and eastern
Tibet Plateau, northern Mongolia,
regions in North America north to 55°N. Anomalies of NDSC were 10-40 days in the northwestern
and the eastern Tibet Plateau, eastern and northern Northwest China, eastern and central Inner Mongolia, western
North China , central Northeast
China, most Mongolia, part of northern Europe, parts of western Russia ,parts
of northern North America. Meanwhile, negative NDSC anomalies were -10―-30 days
in the southern Tibetan Plateau, locations in central Asia
and northwestern
Fig.5 Regional Snow Cover Indices (Unit:
Fig.6. Number of days with snow cover (left) and the anomalies
(right) in the Northern Hemisphere in Autumn 2009 (Unit: day)