Annual high lights
ENSO Monitoring
A weak-moderate El Niño event came into being since August 2006, and finished in February 2007.
The positive SSTa emerged in the central-eastern equatorial Pacific and rose gradually since May 2006, and the SSTa above 0.5ºC were observed in most of the central-eastern equatorial Pacific in August (Fig.1). From August 2006 to January 2007, Niño Z index was greater than 0.5�� for 6 consecutive months, and its accumulative value was 5.8�� (Fig.2). Meanwhile, SOI shifted from the positive value to the negative in May 2006, and it persisted negative value from May 2006 to January 2007 except November. Monitoring result showed, an El Niño event came into being since August 2006.
During February 2007, the SSTa above 0.5�� withdraw and were only observed in the central equatorial Pacific. In most of the eastern equatorial Pacific the SSTa were below 0.5��, and negative anomalies were observed between 140º-120ºW, and Niño Z index was 0.3�� in February. Meanwhile, SOI was �C0.1 and near normal. Monitoring result showed that the El Niño event finished in February 2007.
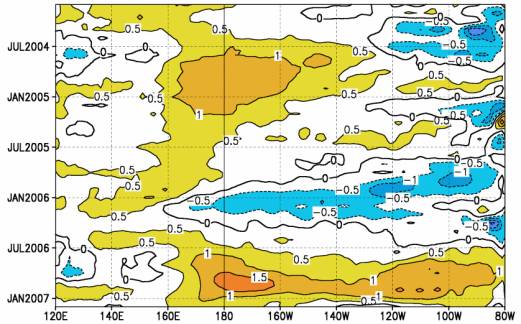
Fig.1 Time-longitude section of SSTA (Unit:��) in the equatorial Pacific (5ºN~5ºS)
Fig.2 Variations of Niño Z indices (Unit: ��) and SOI
East Asian monsoon monitoring
During 2006, East Asian summer monsoon onset as early as normal and came to end later than normal, and it is weaker than average
East
Asian summer monsoon onset
commenced over the South China Sea (SCS) in the 4th
pentad of May, which is near normal, and southwesterly maintained
over regions from South China to the Jiangnan area before the 3rd
pentad of June. During the 4th pentad of June, with the subtropical
high skipping northward, southwesterly advanced to the Huanghuai area.
Meanwhile, 340K isoline of ![]() (potential
pseudo-equivalent temperature) moved northward and remained north of 35ºN during the
period from July to the first dekad of August (Fig.3). During the 4th
pentad of August, 340K isoline of
(potential
pseudo-equivalent temperature) moved northward and remained north of 35ºN during the
period from July to the first dekad of August (Fig.3). During the 4th
pentad of August, 340K isoline of ![]() retreated
southward quickly to 30ºN and did again to 20ºN during the first dekad of September. During the 2nd pentad
of October, 340K isoline of
retreated
southward quickly to 30ºN and did again to 20ºN during the first dekad of September. During the 2nd pentad
of October, 340K isoline of
![]() withdrew from
the SCS, which indicated the warm and humid air had withdrawn from the SCS.
Meanwhile at the 850hPa geopotential height, southwesterly over the SCS also
changed to northeasterly. This indicated that the SCS summer monsoon came to
the end during the 2nd pentad of October 2006, which was later than
normal.
withdrew from
the SCS, which indicated the warm and humid air had withdrawn from the SCS.
Meanwhile at the 850hPa geopotential height, southwesterly over the SCS also
changed to northeasterly. This indicated that the SCS summer monsoon came to
the end during the 2nd pentad of October 2006, which was later than
normal.
The SCS summer monsoon index was -0.79 in 2006, which was weaker than average. Pentad intensities of the SCS summer monsoon were weaker than normal during the most of time (Fig.4). During summer 2006, rainfall totals were more than normal in South China, the Huanghuai area and mid-northern Northeast China, while less than normal in the mid-lower reaches of the Yangtze River (Fig.5).
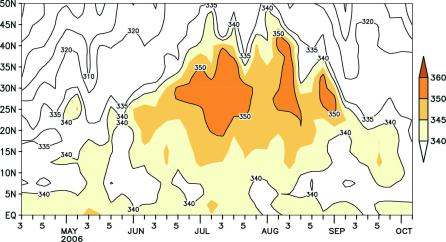
Fig.3 Latitude-time Section of 850hPa ��se(110��120ºE Mean)(Unit:K)
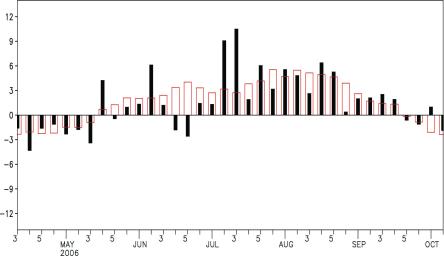
Fig.4 Variation of zonal wind index (Unit: m/s, red open bars stand for climatology) over monitoring region
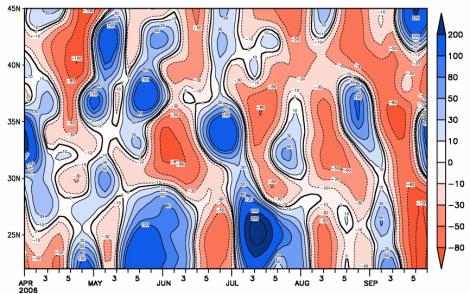
Fig.5 Time-latitude cross section of pentad total precipitation percentage anomalies over 110ºE-120ºE (Unit: %) 2006.04��09
Sonw monitoring
During 2006, areas of snow cover (AOSC) as a whole were observed near normal in the Northern Hemisphere, with slightly largeer than normal in autumn and winter, distinctly smaller than normal in spring and summer.
During boreal winter (2005/2006), the whole AOSC was slightly larger than normal in the Northern Hemisphere, with larger than average in Eurasia and China, smaller than average in the Tibet Plateau. During spring and summer, the whole AOSC was obviously smaller than normal in the Northern Hemisphere, with smaller than average in Eurasia, China and the Tibet Plateau. In autumn, the whole AOSC was larger than normal in the Northern Hemisphere, with larger than average in Eurasia, China and the Tibet Plateau (Fig.6).
During boreal winter (2005/2006), the Number of days with snow cover (NDSC) was found above 80 days in most of Eurasia and North America north to 50ºN. In China, NDSC was found above 80 days in Heilongjiang, northeastern Inner Mongolia, and northwestern Xinjiang. Meanwhile, NDSC was above 10 days more than average in central-southern and southeastern Europe, most of Xinjiang and central-western Inner Mongolia. NDSC was above 10 days less than average in part of northern Iran, Mongolia, central-eastern Tibet Plateau and central-western America (Fig.7).
Fig.6 Regional Snow Cover Anomaly Indices (Unit: 106km2)
(a) Northern Hemisphere (b) Eurasia (c) China (d) Tibetan Plateau
(dashed line: climatology, solid line: monthly snow cover area, red: monthly snow cover area is below climatology, bule: monthly snow cover area is above climatology )
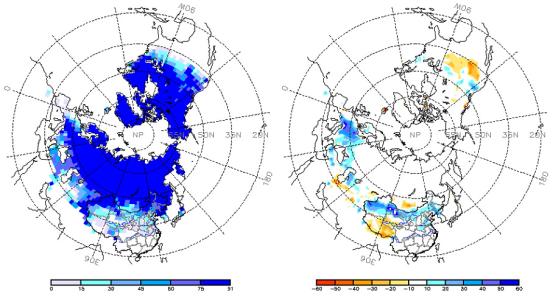
Fig.7 Number of Days with Sonw Cover (left) and its anomalies (right) in the Northern Hemisphere during Dec.2005��Feb.2006 (Unit:day)