Annual Highlights
ENSO Monitoring
A La Niña event came into being since August 2007.
After the
2006/2007 El Niño event ended, sea surface temperatures anomalies (SSTA) in the
central and eastern equatorial Pacific have gradually decreased since February
2007. The negative SSTA in the east-central Pacific have obviously been
extending westward since July 2007 (Fig. 1). During August, NINO Z and NINO 3.4
indices dropped to
The Nino Z index both was
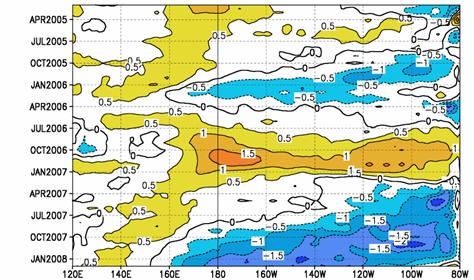
Fig.1 Longitude-time section of SSTA (Unit:℃ ) in the equatorial Pacific (5ºN~5ºS)

Fig.2 Variations of Niño Z indices (Unit: ℃ ) and SOI
East Asian monsoon monitoring
During 2007, East Asian summer monsoon onset was later than normal, came to end later than normal also and it is weaker than average.
The onset of the
South China Sea (SCS) summer monsoon began in the fifth pentad of May, which
was later than normal. After that, southwesterlies
swiftly occupied the SCS-South China and warm and wet air controlled the SCS
(Fig. 3). During the mid-June, southwesterlies moved
northward to the Jianghuai area together with
northward move of the northwest Pacific subtropical high. The Meiyu also prevailed in the area, and warm and wet air
controlled south of the Huanghuai area. During late
July, warm and wet air moved northward to
The SCS summer monsoon index was

Fig.3 Time-latitude section of 850hPa θse (110 ºE~120ºE mean) (Unit:K)
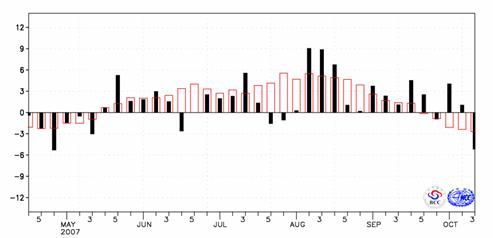
Fig.4 Variation of zonal wind index (Unit: m/s, red open bars stand for climatology) over monitoring region

Fig.5 Time-latitude cross section of pentad total precipitation
percentage anomalies over 110 ºE~120ºE (Unit: %)
Sonw monitoring in northern hemisphere
During 2007, area of snow cover in northern hemisphere as a whole was observed smaller than normal.
During boreal
winter (2006/2007), area of snow cover in northern hemisphere was slightly
smaller than normal, with slightly smaller than average in Eurasia, larger than
average in
During boreal
winter (2006/2007), the Number of days with snow cover (NDSC) was above 75 days
in most of Eurasia and North America north to 50ºN. In

Fig.6 Regional snow cover anomaly
indices (Unit:
(a) Northern Hemisphere, (b) Eurasia, (c) China, and (d) Tibetan Plateau
(dashed line: climatology, solid line: monthly snow cover area, red: monthly snow cover area is below climatology, blue: monthly snow cover area is above climatology)

Fig.7 Number of days with snow cover (left) and its anomalies (right) in the Northern Hemisphere during Dec.2006-Feb.2007 (Unit: d)