Annual high lights
ENSO monitoring
A weak warm water fluctuation occurred during the period from September 2004 to February 2005. SST anomalies exhibited near normal condition in the equatorial Pacific from February to December 2005.
In the early of 2005, SST anomalies decreased quickly in the central and eastern equatorial Pacific, and negative SST anomalies were observed in the eastern Pacific (Fig.1). During February, SST index of Nino Z (Nino 1+2+3+4) dropped to 0.2oC (Fig.2), which showed that the weak warm water fluctuation ended. SST is a little above normal in the most equatorial Pacific from February to August 2005. During September, the cold water in the eastern Pacific westward spread rapidly and the intensity increased. The condition continued to the end of 2005 (Fig.1).
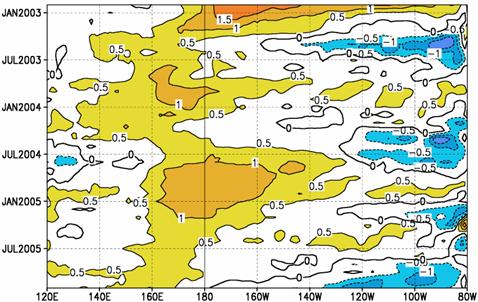
Fig.1 Time-longitude section of equatorial Pacific (5oN ~ 5oS) SST anomaly (Unit: ℃)
2003
2004
2005![]()

Fig.2 Variations of NINO indices (Unit: ℃) and SOI
Monsoon monitoring
The South China Sea (SCS) summer monsoon onset in the 6th pentad of May
2005, about 2 pentads behind the normal date. Southwesterly at 850hPa settled
in
The SCS summer monsoon index was
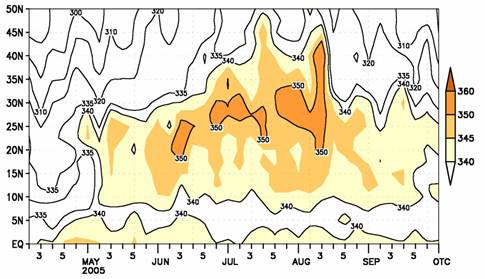
Fig.3 Latitude-time section of zonal averaged (110-120ºE) potential
pseudo-temperature (θse) (Unit: K) at 850hPa
![]()
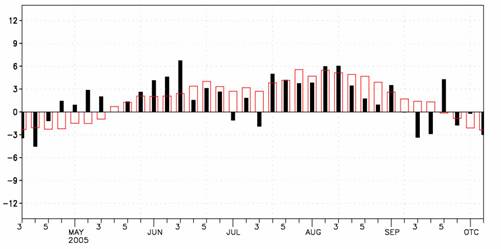
Fig.4 Variation of zonal wind index over SCS (Unit: m/s)
Snow monitoring
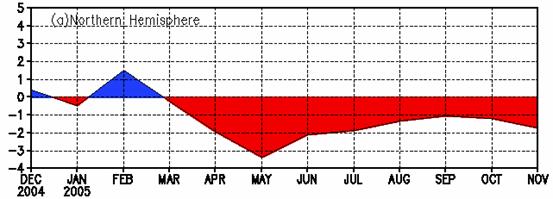
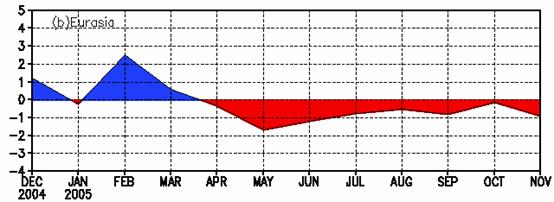
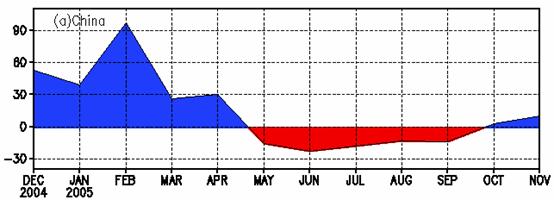
During 2005, areas of snow cover (AOSC) as a whole were observed obviously less than normal in the Northern Hemisphere, with slightly smaller than normal in Eurasia, distinctly larger than normal in China and slightly smaller than normal in the Tibet Plateau (Fig.5).
During boreal winter
(2004-05), the whole AOSC was more than normal in the Northern Hemisphere, with
obviously larger than average in
(c)
(d)
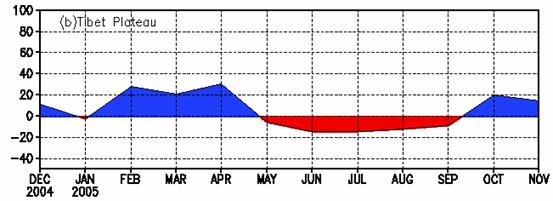
Fig.5 Regional Snow Cover Anomaly Indices (Unit:
(a) Northern Hemisphere (b) Eurasia (c) China (d) Tibetan Plateau
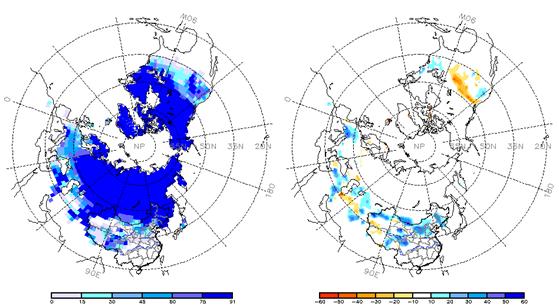
Fig.6 Number of Days with Snow Cover (left) and Anomalies (right) in the Northern Hemisphere during Dec.2004~Feb.2005 (Unit: day).
Remark: Original data are from http://www.cpc.ncep.noaa.gov/data/snow/.Analyse: Climate System Diagnostics and Prediction Division/National Climate Center/CMA. Climatology is from 1973 to 2002 base period mean.